Drupal Techniques: Xdebug, DDEV and Postman
Written on April 19, 2020
Category: Drupal Techniques
Author: David Rodríguez, @davidjguru
 |
|---|
| Picture from Unsplash, user Timothy Dykes, @timothycdykes |
Last Friday I had to perform several code debugging to review several use cases based on the interconnections between a data bus and a Drupal installation. It has been a long time since I debugged REST and in this time, I have gone from using Drupal in a custom LAMP / Docker environment to working only and exclusively with DDEV based Drupal environments.
So “remodeling” at that level the work stack has made me want to take some notes, for the joy of using something as easy as DDEV for the development in a local environment.
This will be an article about configurations for testing REST queries from Postman while debugging requests from the Drupal side connecting Xdebug between PHPStorm and DDEV.
This article is part of a series of posts about Drupal Tips.
1- Drupal Fast Tips (I) - Using links in Drupal 8
2- Drupal Fast Tips (II) - Prefilling fields in forms
3- Drupal Fast Tips (III) - The Magic of ‘#attached’
4- Drupal Fast Tips (IV) - Xdebug, DDEV and Postman
5- Drupal Fast Tips (V) - Placing a block by code
6- Drupal Fast Tips (VI) - From Arrays to HTML
7- Drupal Fast Tips (VII) - Link Fields from Twig
Introduction
In this article I would like to offer a simple scheme to prepare the configuration of a sufficient test environment to test REST to Drupal connections. Just a quick recipe for the tools needed to build the test environment.
Ingredients:
- Xdebug (the classical extension for PHP for debugging).
- PHPStorm (Well, or you opensourcered IDE).
- DDEV (The containerising system Docker-based for PHP projects).
- Drupal and some contrib modules (but not many, actually)
- Postman or Postwoman, as you wish (for API REST testing).
Recipe:
Xdebug
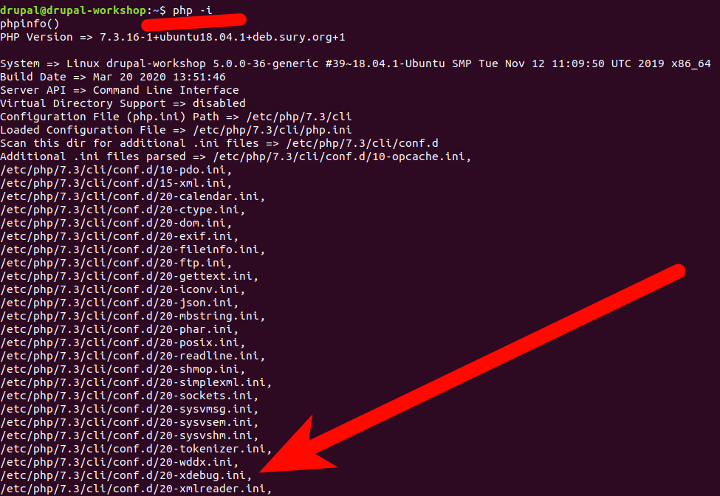
It is the great classic for debugging PHP code, an extension / library to install, configure and run, tracking in real time the values of your variables and the execution flow of your software. It’s a basic resource that you can install easily with sudo apt-get install php-xdebug in a classical LAMP environment, or check if you have the extension installed doing a php -i in your own prompt:

PHPSTORM
PHPStorm is not OpenSource software. In fact, it’s not even free (except for some exceptions of licenses offered to some profiles). But there’s more: It’s an artifact built with Java to program in a language like PHP, which contains methods implemented at a low level with the C language. What’s interesting about this? Well, PHPStorm is the LEVIATHAN, the most extended IDE and currently, part of the de-facto standard to work with PHP/Drupal. If you prefer an open source tool, then I recommend VSCode or its compiled version without telemetry and tracking elements from Microsoft, VSCodium (with the extensions/Plugins also available).
DDEV
Did I already say that working with DDEV means reaching the Satori? If you haven’t read me about this topic, I recommend you get to know the tool or visit some of the articles I have already published, here or at my other website https://www.therussianlullaby.com:
- Creating development environments for Drupal with DDEV.
- Docker, Docker-Compose and DDEV - Cheatsheet.
- Books/ Local Web development with DDEV.
Drupal Module REST UI
Some people are using Drupal Console commands to enable REST resources in a Drupal installation, while others are using the interface. Specifically, after some compatibility issues with Symfony in Drupal Console for latest versions of Drupal, it may be more stable to use the interface. So install this module to enable REST resources in Drupal.
Postman
Another classic tool for testing API REST clients in your projects. You can use Postman or Postwoman as an alternative web (and opensource) to Postman. Here Postman is used as a client for testing REST services. Just download the application and install it in your system.
Xdebug on DDEV and true happiness
First of all, you need to install the Docker Engine for DDEV, so review the installing process for DDEV and put it running in your machine. Or execute all the steps from the next Gist as a fast recipe:
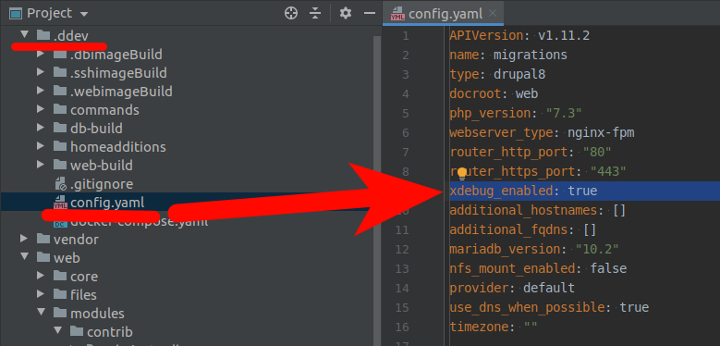
With the DDEV-based Drupal installation, you will have Xdebug installed by default, just make sure you have the extension enabled in your DDEV installation’s own configuration for the project, through the config.yaml file, by setting the xdebug_enabled configuration variable to true:

After changing this, you will only have to restart the web container ddev start to take the new value and have Xdebug available. But this will set xdebug all the time for your installation, and if you only want enable / disable xdebug in certain moments, then better you use the following commands (Only when you need to activate xdebug and not always have it by default. ):
ddev exec enable_xdebug
ddev exec disable_xdebug
Config PHPStorm
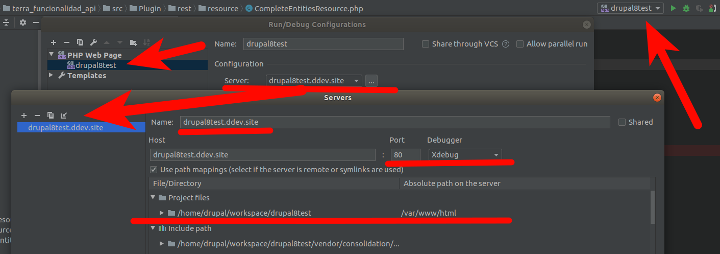
Now we’re gonna enable Xdebug in our PHPStorm installation, by clicking in Edit Configuration / Run, clicking in the ‘+’ symbol and then add a new configuration as ‘PHP Web Page’ and load a new Server, mapping paths between your local folder route and the internal in the DDEV web container, all summarized in the following screenshot. Take a fast view:

Or if you want step-by-step, then open your PHPStorm an follow the next dots:
- Go to your main navigation menu
- Go to File / Settings
- Languages & Frameworks -> PHP
- Servers -> +
And configure your server connection to the DDEV web container (that will have xDebug enabled):

Now you can use Xdebug for your debugging…in a on-browser debugging scenario, you would have to install an extension Xdebug helper for Chrome or Xdebug Helper for Firefox. We have already our IDE listening, but now we want to test for REST services.
From Postman to your Drupal installation
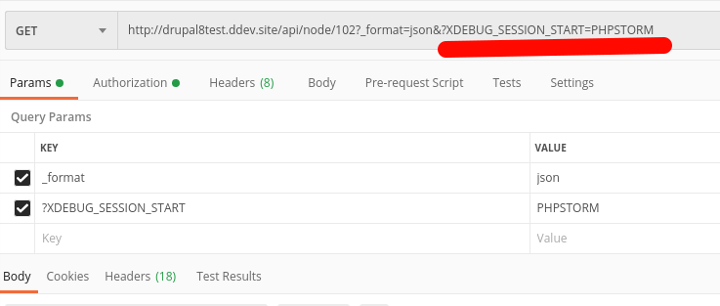
Well, tipically we rely on a browser extension to trigger Xdebug, ok. But now we’re using Postman and this is its own scenario….We can’t use browser extensions, so we’ll need a key, a token wich launch the application. We’re going to use a parameter adding it to the GET petitions, just use XDEBUG_SESSION_START=PHPSTORM.

Now you can set your breakpoints ready to follow the flow of your code.
